Parameter vs. Statistic: Unveiling the Key Differences in Data Analysis
Navigating the world of data analysis can feel like traversing a complex maze, filled with unfamiliar terms and concepts. Among the most crucial distinctions to grasp are those between a parameter and a statistic. Understanding this difference is fundamental to interpreting data accurately and drawing meaningful conclusions. This article will delve into the intricacies of parameters and statistics, providing clear explanations, real-world examples, and expert insights to empower you with a robust understanding of these core statistical concepts. We aim to provide a depth of knowledge exceeding typical explanations, equipping you to confidently apply these principles in your own analyses. Our focus is on clarity, accuracy, and practical application, ensuring you gain not just theoretical knowledge but also the ability to discern and utilize parameters and statistics effectively.
Deciphering Parameters and Statistics: A Comprehensive Overview
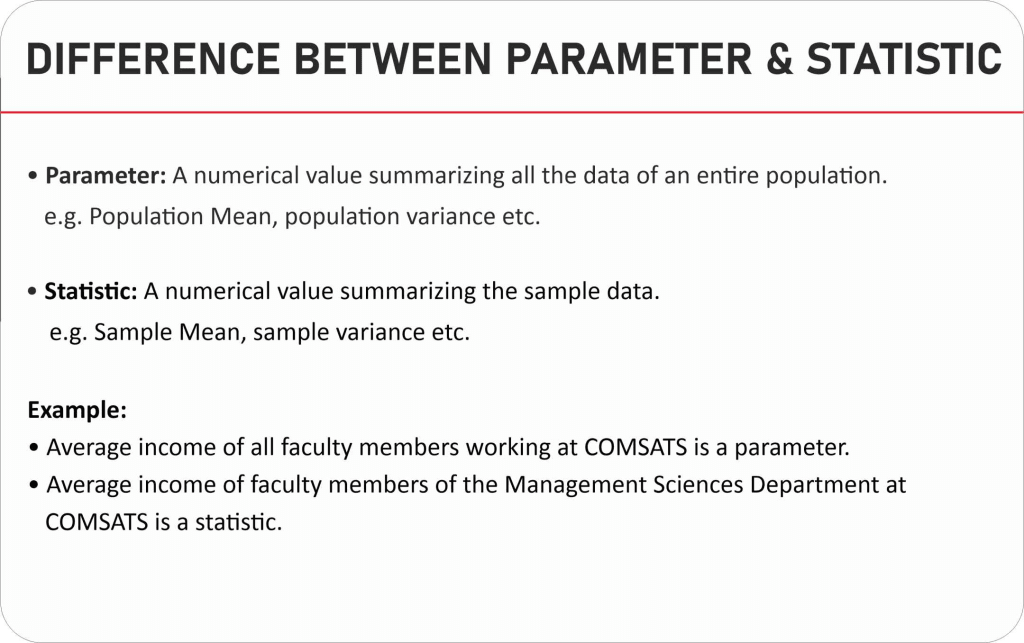
At their core, both parameters and statistics are numerical values that describe characteristics of a group. However, the key difference lies in which group they describe. A parameter describes a characteristic of an entire population, while a statistic describes a characteristic of a sample taken from that population. To understand this better, let’s break down each concept individually.
Parameters: Describing the Whole Population
A parameter is a value that represents a true characteristic of a population. Think of it as the definitive measurement for the entire group you’re interested in studying. Because it’s based on the entire population, a parameter is typically a fixed, though often unknown, value. Consider these characteristics of parameters:
- Population-Based: Parameters relate directly to the entire group under investigation.
- Fixed Value: A parameter is a constant value, representing the true population characteristic.
- Often Unknown: In many real-world scenarios, it’s impractical or impossible to measure the entire population, so the parameter remains unknown.
- Examples: The average height of all women in the United States, the proportion of defective products in an entire production run, or the total number of registered voters in a country.
For example, imagine you want to know the average income of all residents in a specific city. If you could somehow collect income data from every single resident and calculate the average, that would be a parameter. However, this is usually not feasible.
Statistics: Estimating Population Characteristics from Samples
A statistic, on the other hand, is a value calculated from a sample of data. A sample is a subset of the population, chosen to represent the larger group. Since a statistic is based on a portion of the population, it’s used to estimate the corresponding parameter. Here’s what you need to know about statistics:
- Sample-Based: Statistics are calculated from a subset of the population.
- Estimate of Parameter: Statistics are used to infer information about the population parameter.
- Variable Value: Because different samples can be drawn from the same population, a statistic can vary from sample to sample.
- Examples: The average height of 100 randomly selected students in a university, the proportion of voters in a poll who support a particular candidate, or the average test score of students in a classroom.
Returning to the example of city residents’ income, instead of surveying everyone, you might randomly select a few hundred residents and ask about their income. The average income calculated from this sample would be a statistic. This statistic is then used as an estimate of the true average income (the parameter) of all residents in the city.
The Relationship Between Parameters and Statistics
Statistics are tools that help us understand parameters. Because it is often impossible or impractical to study an entire population, we rely on statistics to make inferences about the corresponding parameters. The process of using statistics to estimate parameters is called statistical inference.
It’s important to note that a statistic is just an estimate of the parameter, and it’s subject to sampling error. Sampling error is the difference between the statistic and the parameter. The goal of statistical methods is to minimize sampling error and provide the most accurate estimate possible. Techniques like increasing sample size and using appropriate sampling methods can help reduce sampling error.
The Vital Role of Statistics in Modern Data Science
In today’s data-driven world, the ability to extract meaningful insights from data is more crucial than ever. Statistics play a pivotal role in various fields, including business, healthcare, social sciences, and engineering. Statistical methods are used to analyze data, identify trends, make predictions, and inform decision-making.
Consider the field of marketing. Companies use statistics to analyze customer data, identify target markets, and optimize marketing campaigns. For example, they might conduct surveys to gather data on customer preferences and use statistical analysis to determine which marketing messages are most effective. Similarly, in healthcare, statistics are used to analyze clinical trial data, evaluate the effectiveness of treatments, and identify risk factors for diseases. Public health officials rely on statistics to track disease outbreaks and implement interventions.
Delving into Descriptive and Inferential Statistics
The field of statistics can be broadly divided into two main branches: descriptive statistics and inferential statistics. Understanding the distinction between these branches is essential for applying statistical methods effectively.
Descriptive Statistics: Summarizing and Presenting Data
Descriptive statistics involve methods for summarizing and presenting data in a meaningful way. These methods help to describe the main features of a dataset, such as its central tendency, variability, and distribution. Descriptive statistics include measures such as:
- Mean: The average value of a dataset.
- Median: The middle value in a sorted dataset.
- Mode: The most frequent value in a dataset.
- Standard Deviation: A measure of the spread or dispersion of data around the mean.
- Range: The difference between the maximum and minimum values in a dataset.
- Frequency Distributions: Tables or graphs that show the number of times each value or category occurs in a dataset.
Descriptive statistics are used to provide a clear and concise summary of data, making it easier to understand and interpret. For example, a researcher might use descriptive statistics to summarize the demographic characteristics of participants in a study, such as their age, gender, and education level.
Inferential Statistics: Drawing Conclusions About Populations
Inferential statistics involve methods for using sample data to make inferences or generalizations about a population. These methods allow us to draw conclusions that extend beyond the immediate data at hand. Inferential statistics include techniques such as:
- Hypothesis Testing: A method for testing a specific claim or hypothesis about a population parameter.
- Confidence Intervals: A range of values that is likely to contain the true population parameter with a certain level of confidence.
- Regression Analysis: A method for examining the relationship between two or more variables.
- Analysis of Variance (ANOVA): A method for comparing the means of two or more groups.
Inferential statistics are used to make predictions, test hypotheses, and draw conclusions about populations based on sample data. For example, a political pollster might use inferential statistics to estimate the proportion of voters who support a particular candidate, based on a sample of registered voters. A medical researcher might use inferential statistics to determine whether a new drug is effective in treating a disease, based on data from a clinical trial.
Navigating the Nuances of Statistical Inference
Statistical inference is a powerful tool, but it’s essential to use it correctly and be aware of its limitations. Here are some key considerations when making inferences about populations:
- Sample Representativeness: The sample must be representative of the population to ensure that the inferences are valid. Random sampling is a common technique for selecting a representative sample.
- Sample Size: The sample size should be large enough to provide sufficient statistical power. Larger samples generally lead to more accurate estimates.
- Statistical Assumptions: Many statistical methods rely on certain assumptions about the data, such as normality or independence. It’s important to check whether these assumptions are met before applying the methods.
- Potential Biases: Be aware of potential sources of bias that could affect the results. Bias can arise from various sources, such as selection bias, measurement bias, or response bias.
By carefully considering these factors, you can increase the reliability and validity of your statistical inferences.
Illustrative Examples: Parameters vs. Statistics in Action
Let’s consider a few more examples to further illustrate the difference between parameters and statistics:
- Example 1: A university wants to know the average GPA of all its undergraduate students. Since it’s impractical to collect data from every student, they randomly select 500 students and calculate their average GPA. The average GPA of the 500 students is a statistic, which is used to estimate the average GPA of the entire undergraduate population (the parameter).
- Example 2: A manufacturing company produces light bulbs. To assess the quality of their production, they test every single light bulb produced in a day and calculate the percentage of defective bulbs. The percentage of defective bulbs for that day’s production is a parameter, because it’s based on the entire population of light bulbs produced that day.
- Example 3: A market research firm wants to know the proportion of adults in a city who prefer a certain brand of coffee. They conduct a survey of 1,000 randomly selected adults and find that 60% of them prefer the brand. The 60% is a statistic, which is used to estimate the proportion of all adults in the city who prefer the brand (the parameter).
Addressing Common Misconceptions
One common misconception is that statistics are always inaccurate or unreliable. While it’s true that statistics are subject to sampling error, they can provide valuable insights when used correctly. By using appropriate statistical methods and carefully considering the limitations of the data, we can obtain reliable estimates of population parameters.
Another misconception is that parameters are always knowable. In many real-world scenarios, it’s simply impossible to measure the entire population, so the parameter remains unknown. In these cases, we rely on statistics to make the best possible estimate.
The Indispensable Role of Statistical Software
In the modern era of data analysis, statistical software has become an indispensable tool for researchers, analysts, and practitioners. These software packages provide a wide range of statistical methods and tools, making it easier to analyze data, perform calculations, and create visualizations. Some popular statistical software packages include:
- R: A free and open-source programming language and software environment for statistical computing and graphics.
- Python (with libraries like NumPy, SciPy, and Pandas): A versatile programming language with powerful libraries for data analysis and scientific computing.
- SPSS: A widely used statistical software package for social science research.
- SAS: A comprehensive statistical software package for data management, advanced analytics, and business intelligence.
- Stata: A statistical software package commonly used in economics, sociology, and other fields.
These software packages can greatly simplify the process of statistical analysis, allowing you to focus on interpreting the results and drawing meaningful conclusions.
Statistical Significance: Distinguishing Real Effects from Chance Variation
A crucial concept in inferential statistics is statistical significance. Statistical significance refers to the likelihood that the results of a study are not due to chance alone. In other words, it indicates whether the observed effect is likely to be a real effect, rather than a random variation.
Statistical significance is typically assessed using a p-value, which is the probability of obtaining the observed results (or more extreme results) if the null hypothesis is true. The null hypothesis is a statement that there is no effect or no relationship between the variables being studied. A small p-value (typically less than 0.05) indicates strong evidence against the null hypothesis, suggesting that the results are statistically significant.
It’s important to note that statistical significance does not necessarily imply practical significance. A statistically significant result may be small in magnitude or have limited practical importance. It’s crucial to consider both statistical and practical significance when interpreting the results of a study.
Ethical Considerations in Statistical Analysis
As with any form of research, ethical considerations are paramount in statistical analysis. It’s essential to conduct statistical analyses in a responsible and ethical manner, ensuring that the results are accurate, unbiased, and transparent. Some key ethical considerations include:
- Data Integrity: Ensure that the data is accurate, complete, and free from errors.
- Avoiding Bias: Minimize potential sources of bias in the data collection and analysis process.
- Transparency: Clearly disclose all methods and assumptions used in the analysis.
- Responsible Interpretation: Interpret the results in a fair and objective manner, avoiding exaggeration or misrepresentation.
- Confidentiality: Protect the privacy and confidentiality of participants.
By adhering to these ethical principles, you can ensure that your statistical analyses are trustworthy and contribute to the advancement of knowledge.
The Power of Understanding Parameters and Statistics
The distinction between parameters and statistics is a cornerstone of statistical understanding. Grasping this difference allows you to interpret data with greater accuracy and make informed decisions based on evidence. By understanding how statistics are used to estimate parameters, you can critically evaluate research findings, identify potential biases, and draw meaningful conclusions.
Continuing Your Statistical Journey
This article has provided a comprehensive overview of parameters and statistics, but the world of statistics is vast and ever-evolving. To further enhance your statistical knowledge, consider exploring advanced topics such as regression analysis, time series analysis, or machine learning. The ability to analyze data effectively is a valuable skill in today’s data-driven world, opening doors to exciting career opportunities and empowering you to make a positive impact on society.
